
 |
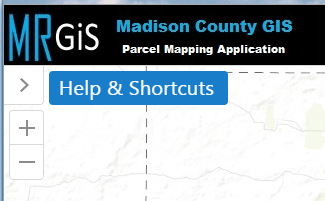
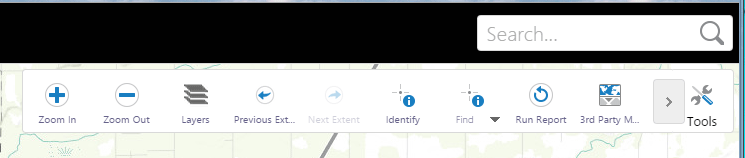
The upper left hand corner will provide access to useful tools that include:
|
| *** ZOOM TIP - Zooming can also be accomplished use the mouse scroll wheel OR hold 'Shift' and draw box around area with mouse to zoom into. | |
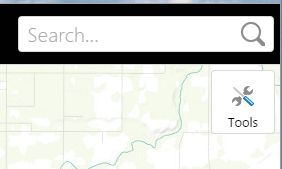 |
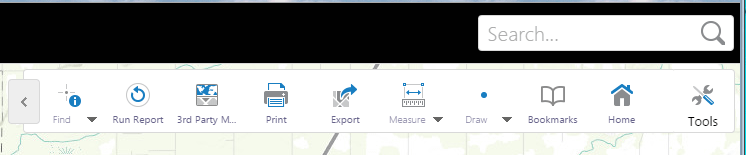
The upper right hand corner will provide access to the search box and useful map tools.
|
| *** SEARCH TIPS - Abbreviate the full street type (use “st” for street, “dr” for drive, etc.) AND Abbreviate directionals in street address (“N” for North, “S” for South, etc.) | |
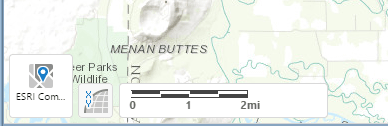 |
The lower Left Hand Corner will provide access:
|
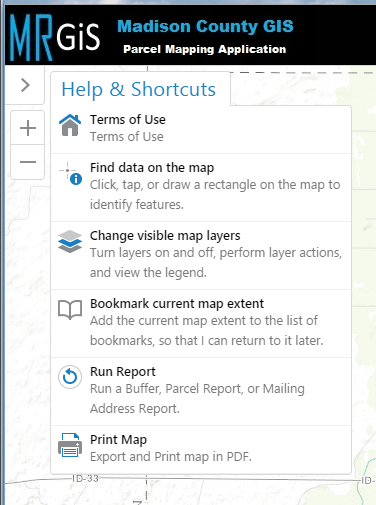
The Help & Shortcuts window will provide quick access to the most helpful and common utilities for the Madison County Map Viewer.
|
 |
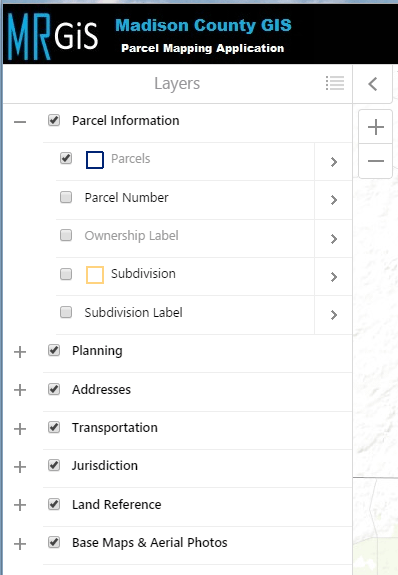
The Layers Menu shows available map feature information that can be selected which will then make the feature visible on the map. The most common features have been selected by default, however they can be de-selected if needed. The layer lists submenu’s can be expanded by clicking on the plus sign icon, which also allows viewing the legend for that available sub layer. As the layers and sub layers are selected the selected feature will then be rendered (drawn) on the map. Some features have a scale dependency placed upon them requiring a certain zoomed in level to see them. Greyed out sub layers will not display in the current zoomed extent (change the zoom to see those features on the map). |
 |
|
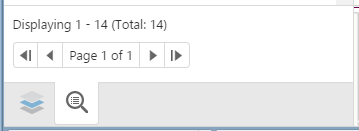 |
When the expanded view is open, there are tabs on the bottom to access different options to view, such as, Layers, Selected Parcels, Reports, etc. | |
| The Basemap section offers a choice of background Basemap images to choose from for your map interface. The default imagery is an ESRI community Basemap. | |
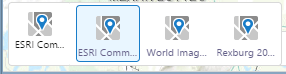 |
Additional Basemaps:
|
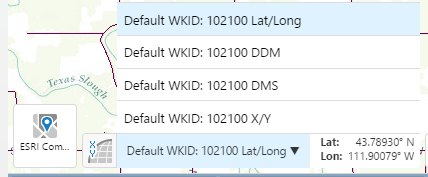 |
The coordinate system toolbar offers a choice of coordinate system options, including XY coordinates and Latitude/Longitude coordinates. |
| Tools can be expanded & collapsed by clicking the Tools Icon. Once open, the toolbar can slide left or right to make other tools available, by using the slide arrow icons. | |
The Tools Menu contains:
|
|
|
|
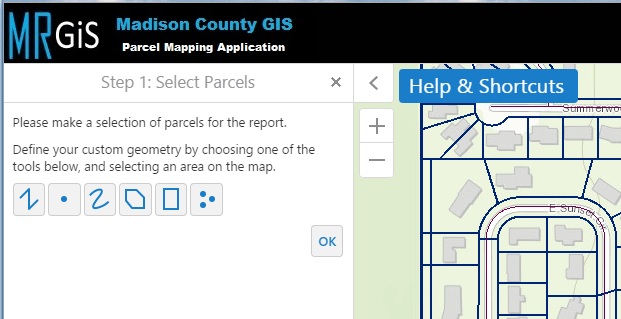 |
Reports can be a powerful tool to gather map information regarding selected parcels. Reports can be accessed in two ways, either from the “Tools” in the upper right hand corner, or from the Help & Shortcuts menu. The reports will be made available in a pdf format. |
| After selecting Run Reports, the report workflow will begin by displaying the Select Parcel step (as shown above). | |
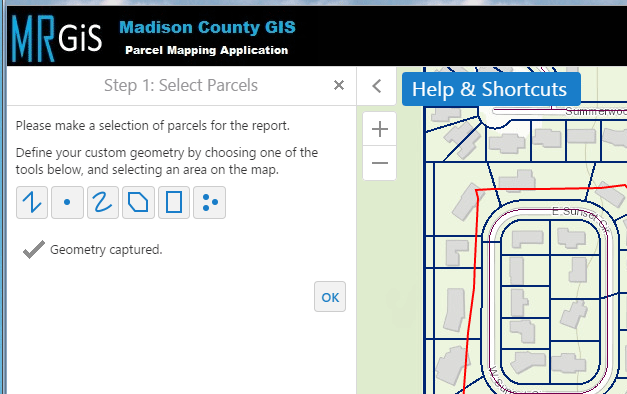 |
Choose the geometry option (polyline, point, freehand, polygon, rectangle, or multiple points) and press OK. |
| *** If a wrong selection has been made or a needed parcel was not selected, the next step will allow modifying the selection. | |
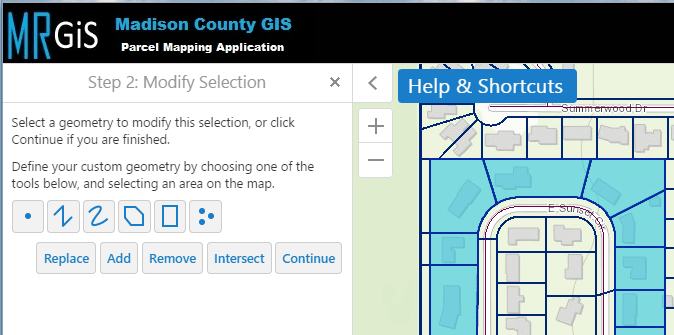 |
If the selection needs modified, choose again the desired geometry option, click on the parcel(s) then choose the required action (Replace, Add, Remove, Intersect). |
| *** Once satisfied with selection, click “Continue” | |
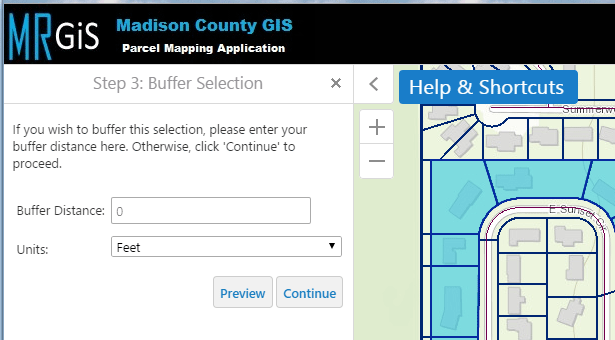 |
Buffer allows to expand the selection by a desired buffer distance. Simply enter your desired distance, and select desired measurement units and click, “Continue” |
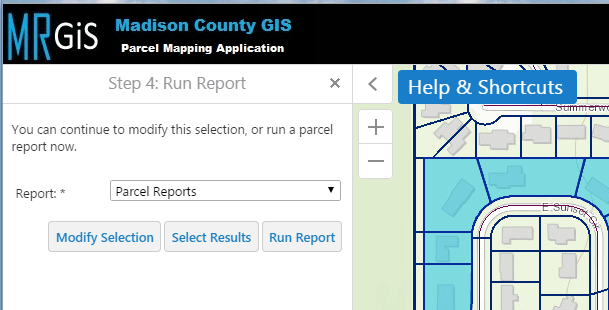 |
Choose the desired Report
|
| Click on "Run Report" *** There may be a delay, while the report processes, until the Report Complete screen appears. |
|
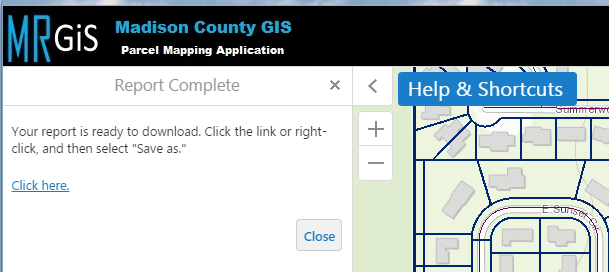 |
At the Report Complete screen use the “Click Here” link to open the report. The report will open in a new window in a PDF format. |
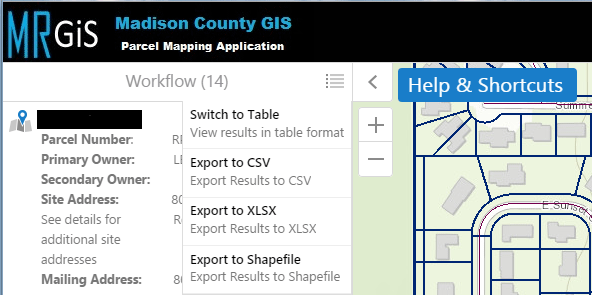 |
After selecting various parcels, or going through the Report workflow, there is also capability to export the data that has been selected. The data can be exported from the Panel actions menu, at the top of the expanded view menu. Available Export options include:
|
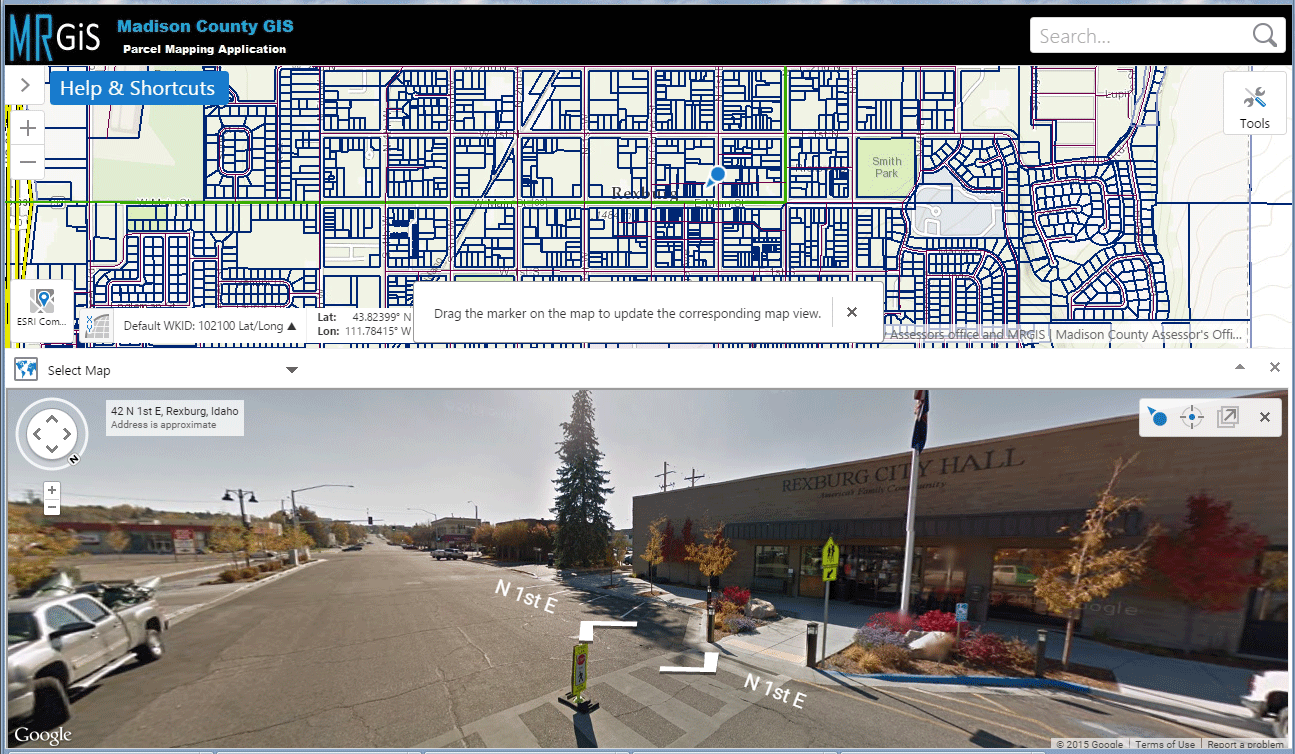
| This utility provides a unique and fun experience to view the map using a choice of available 3rd party interfaces, such as Google Street view. This will allow an integration and a synchronization between the MRGIS map application and the 3rd Party Map service. | |
 |
|
| In the MRGIS map application, the viewpoint marker can be moved around to have the 3rd party map reflect the desired viewpoint of the map. | |
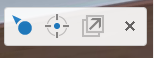 |
Additional controls include:
|